iOS 14 gave users the ability to add widgets to any screen. We decided to support this feature in Yandex Maps, starting with one of the main reasons people use Maps every day — traffic information.
Process
My first idea was to create a level-based widget without a map. It simplified the way we could show traffic conditions using color coding and travel time to work or home.
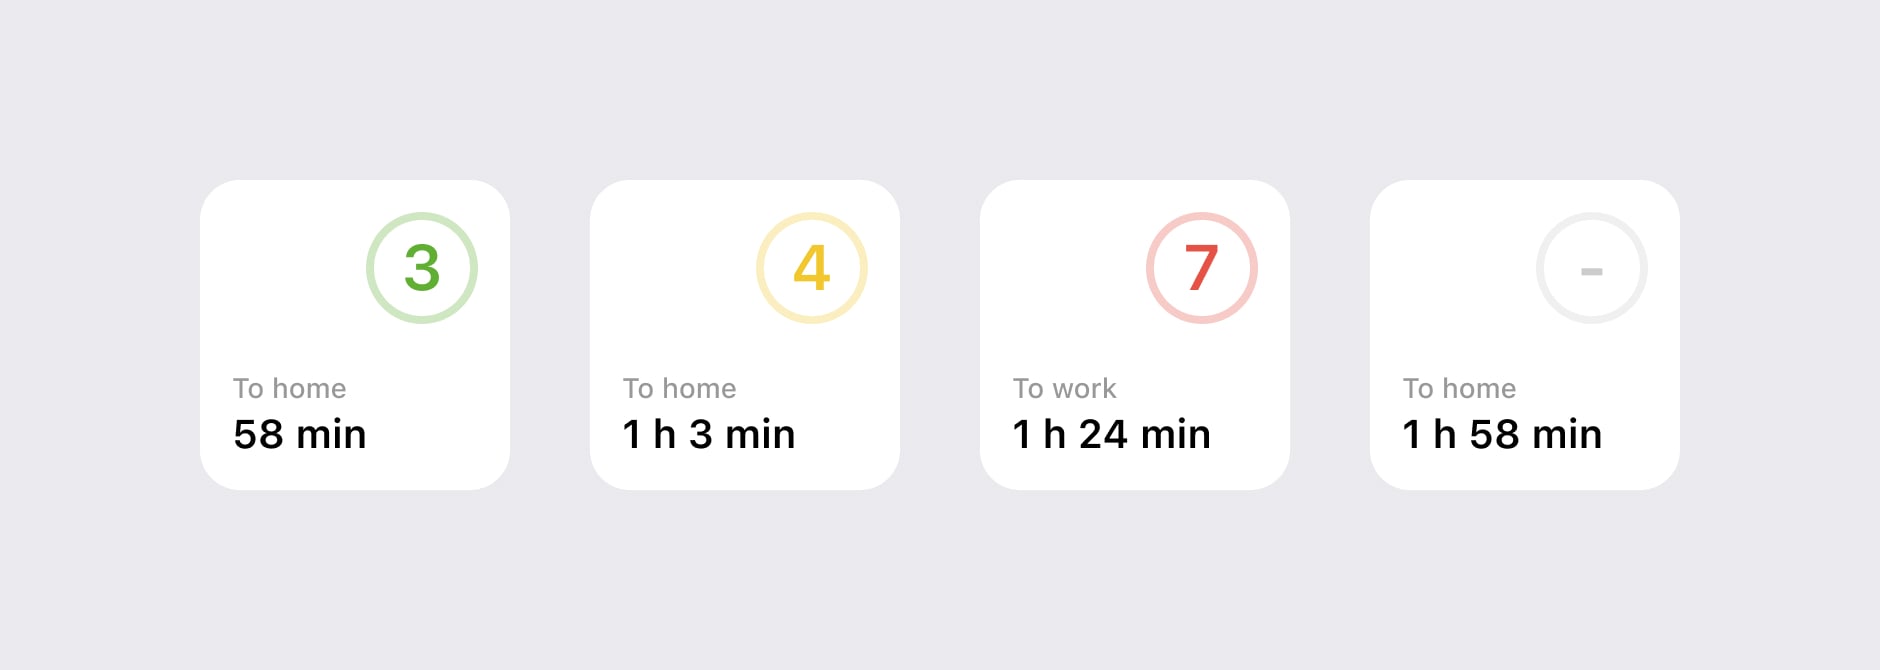
I tried several color options, but many of them felt too aggressive and distracting.
The main issue with this approach was context. The traffic level represented the whole city and didn’t reflect the user’s actual location.
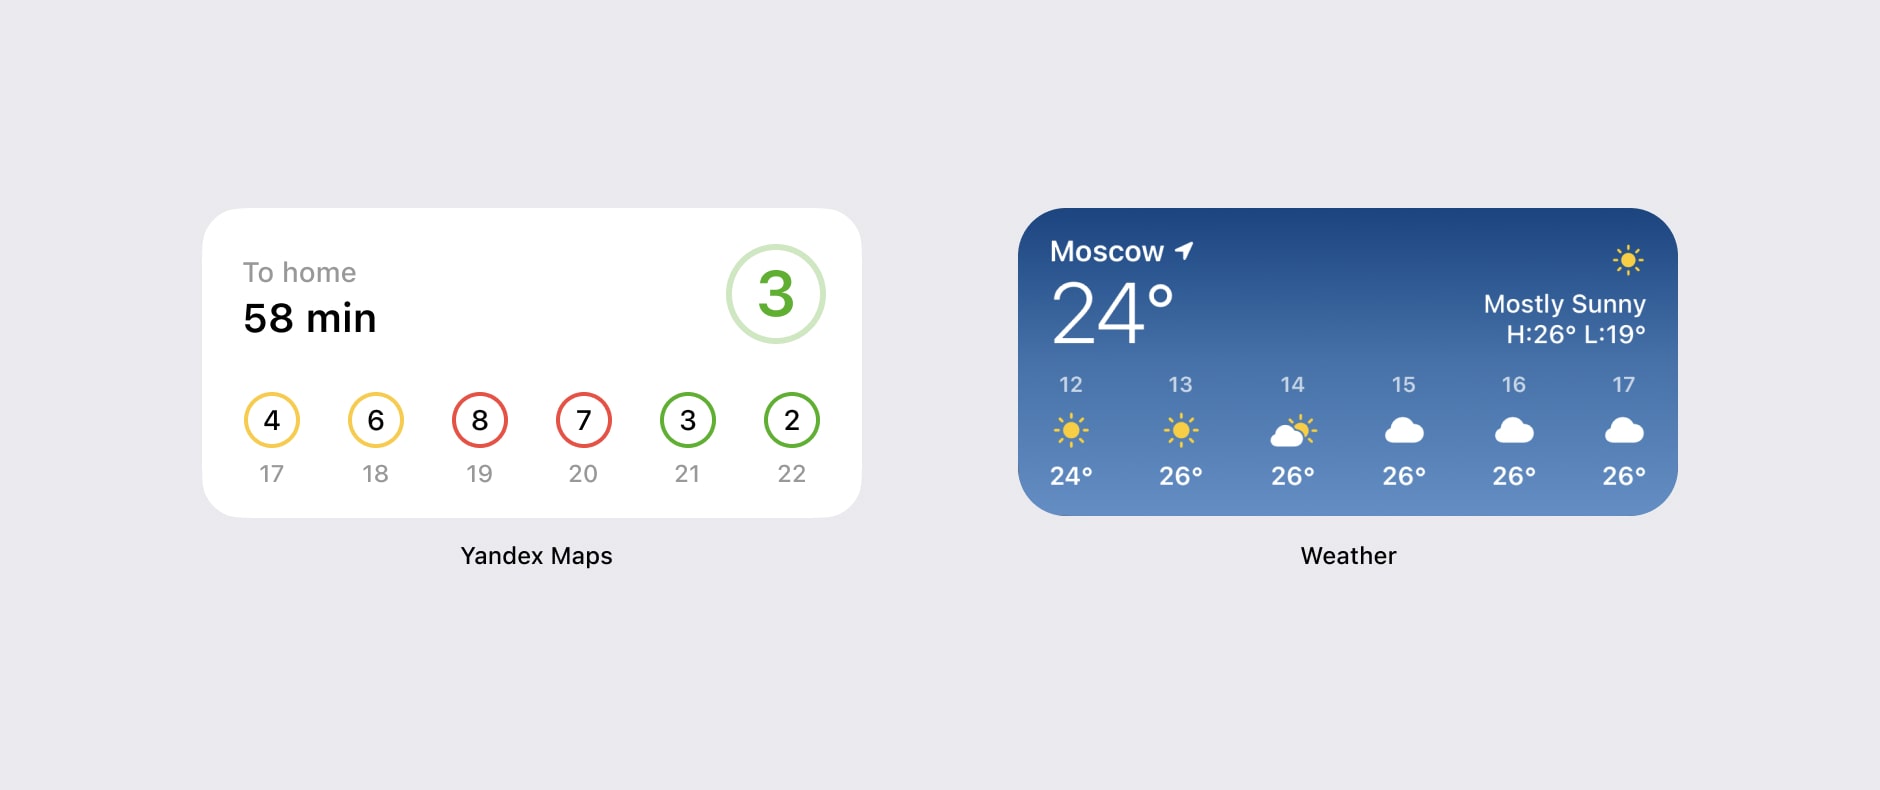
I explored an analogy with the weather widget. However, unlike weather, traffic conditions vary significantly within a city, which made a single level misleading.
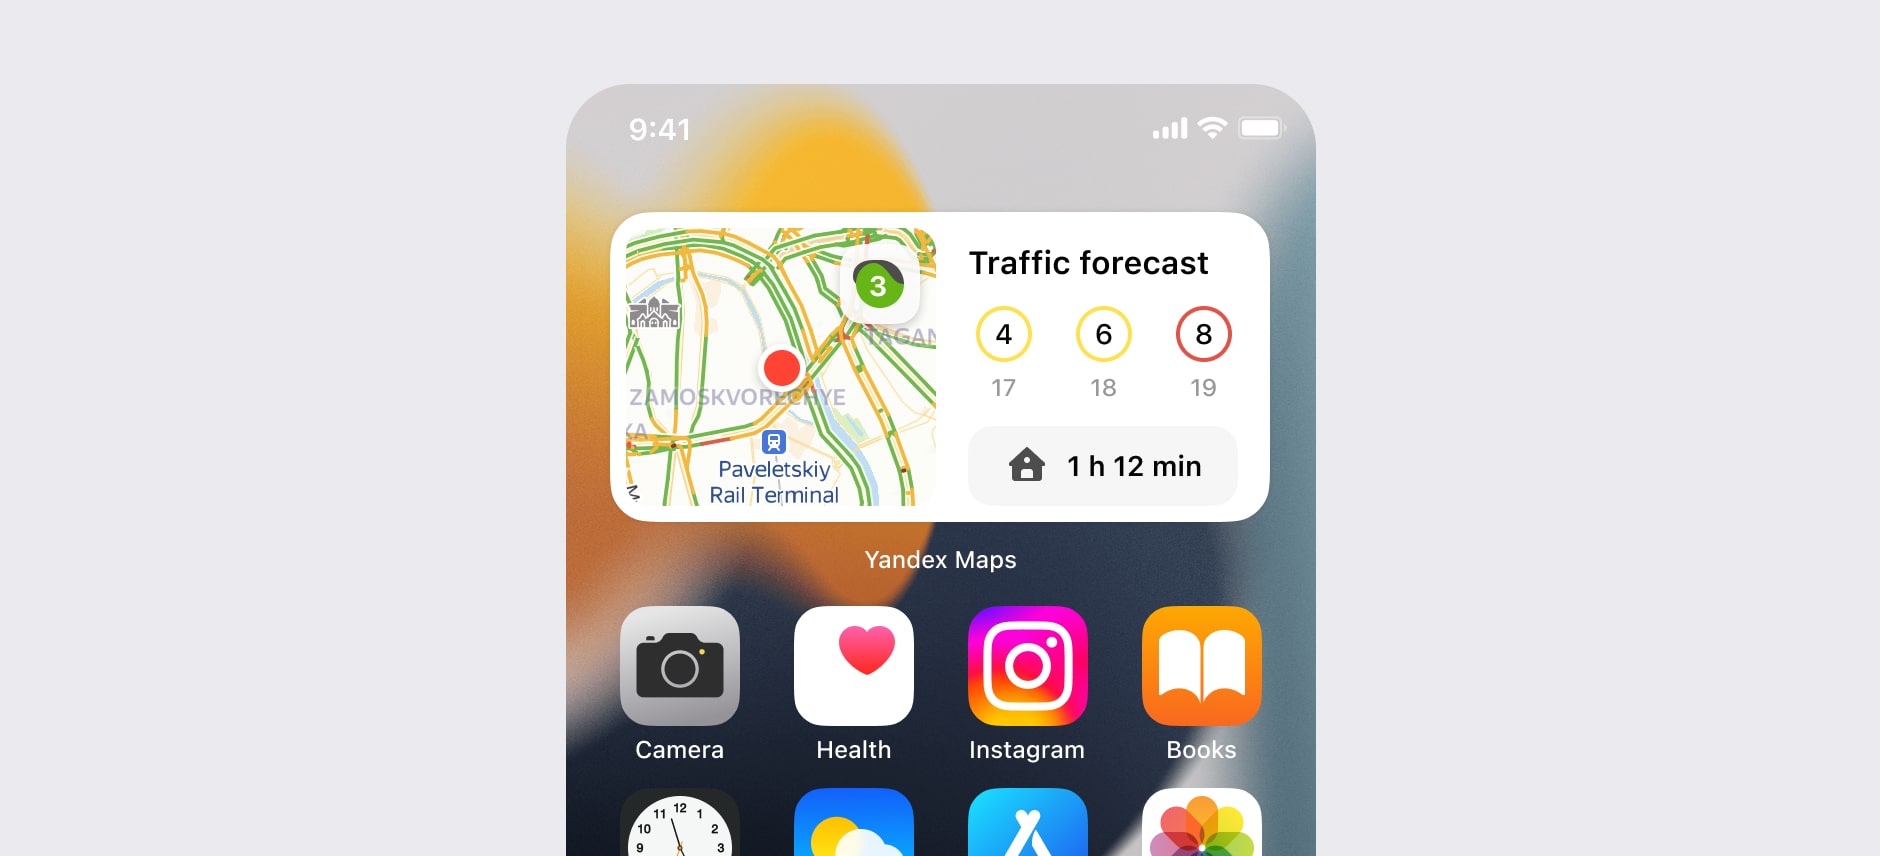
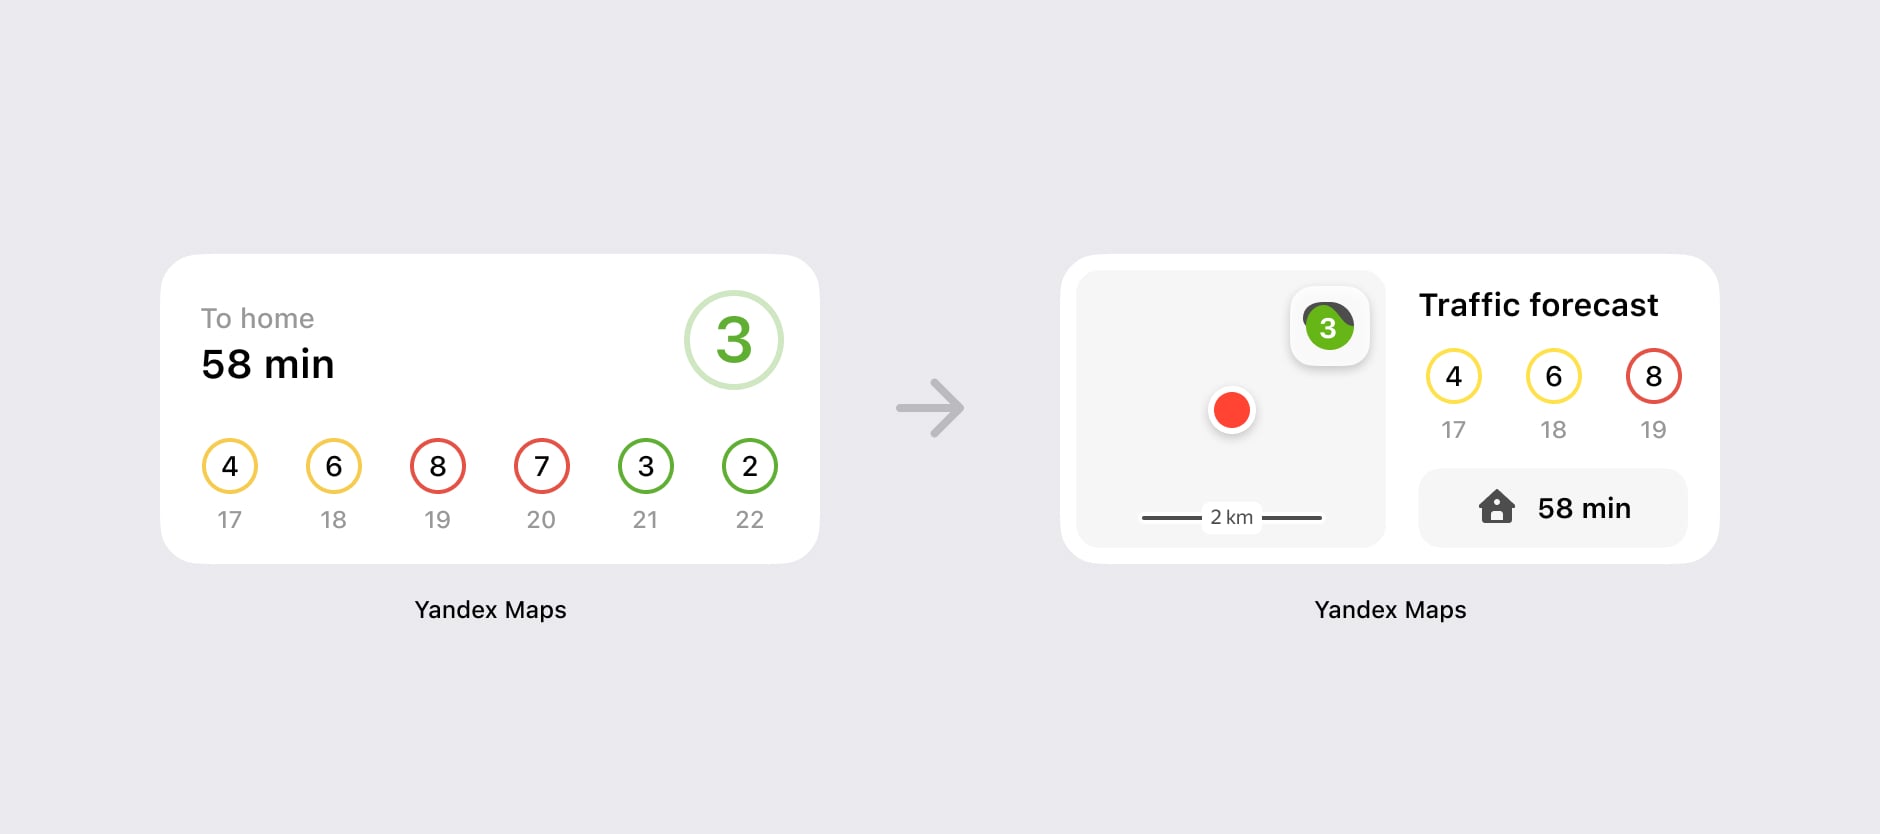
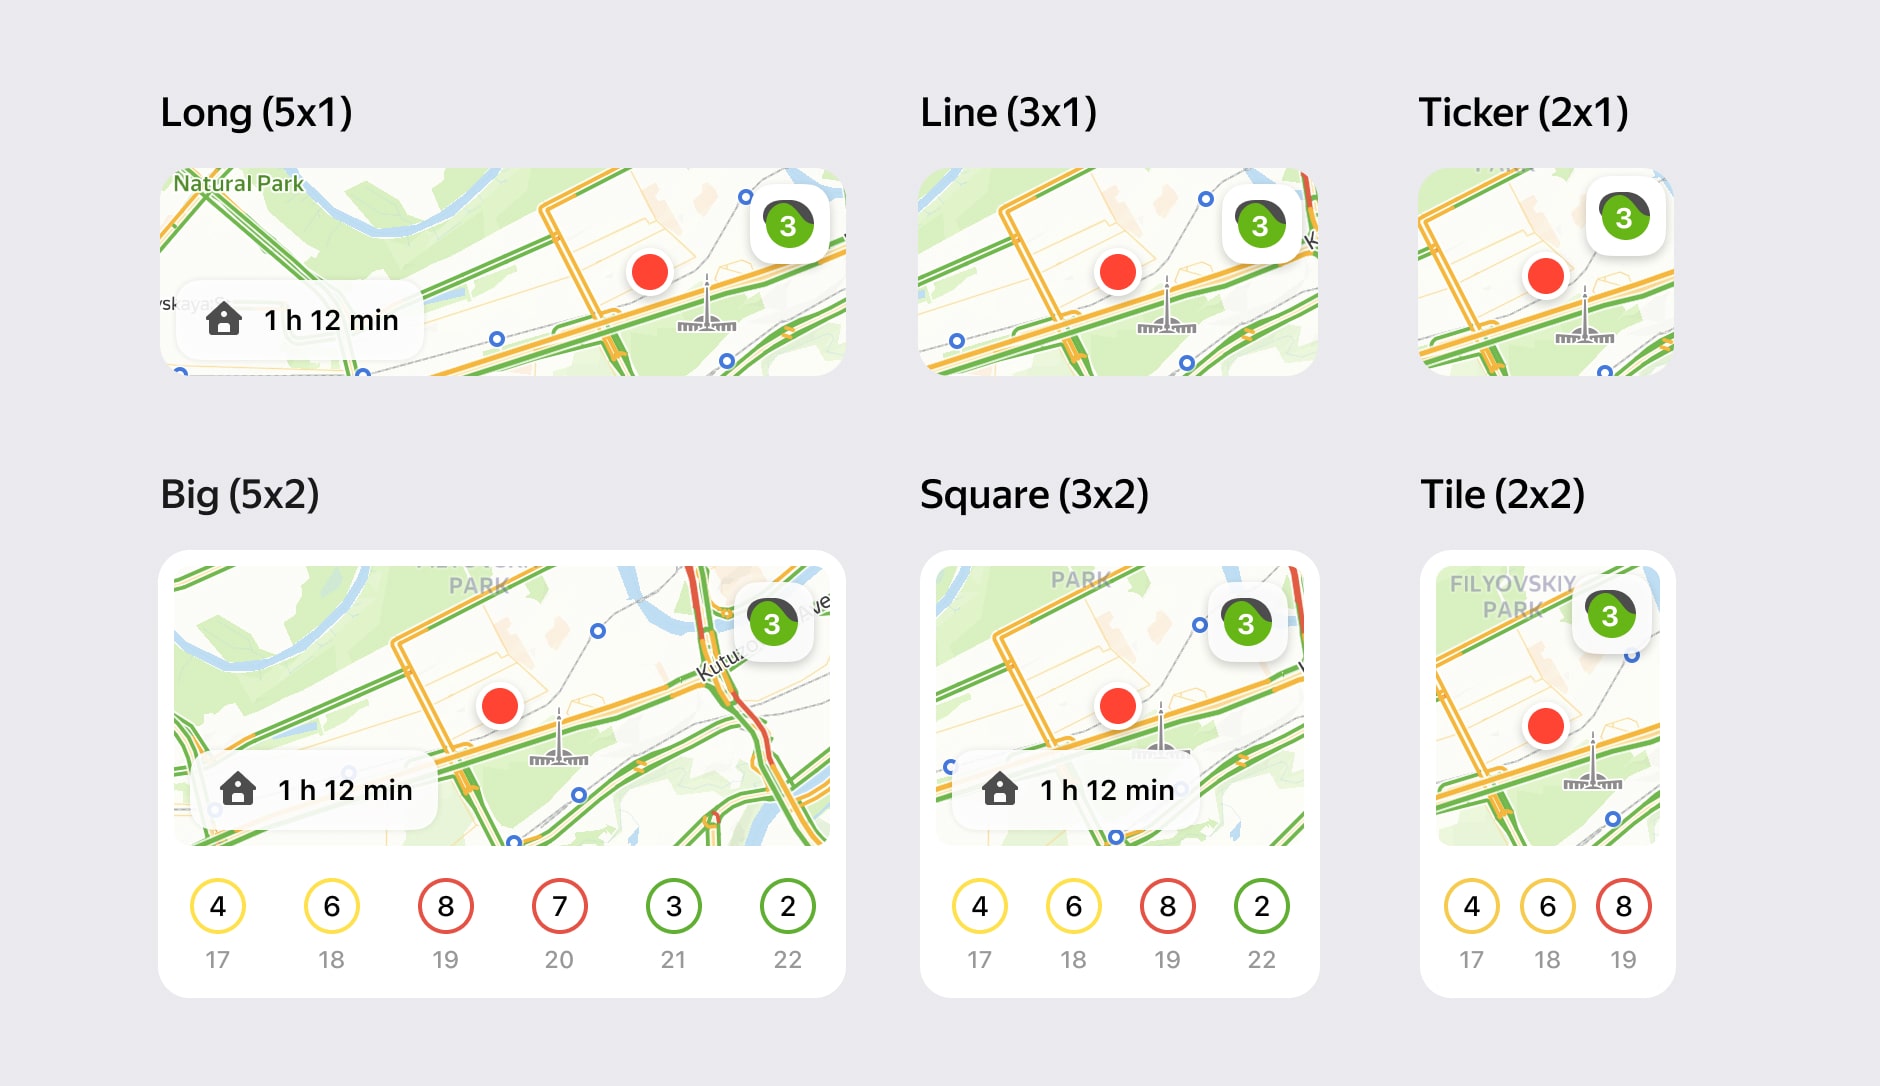
That’s why I decided to show the actual map with a traffic layer. It allows users to understand the real situation around them. The traffic forecast remained useful, and the route button became more prominent.
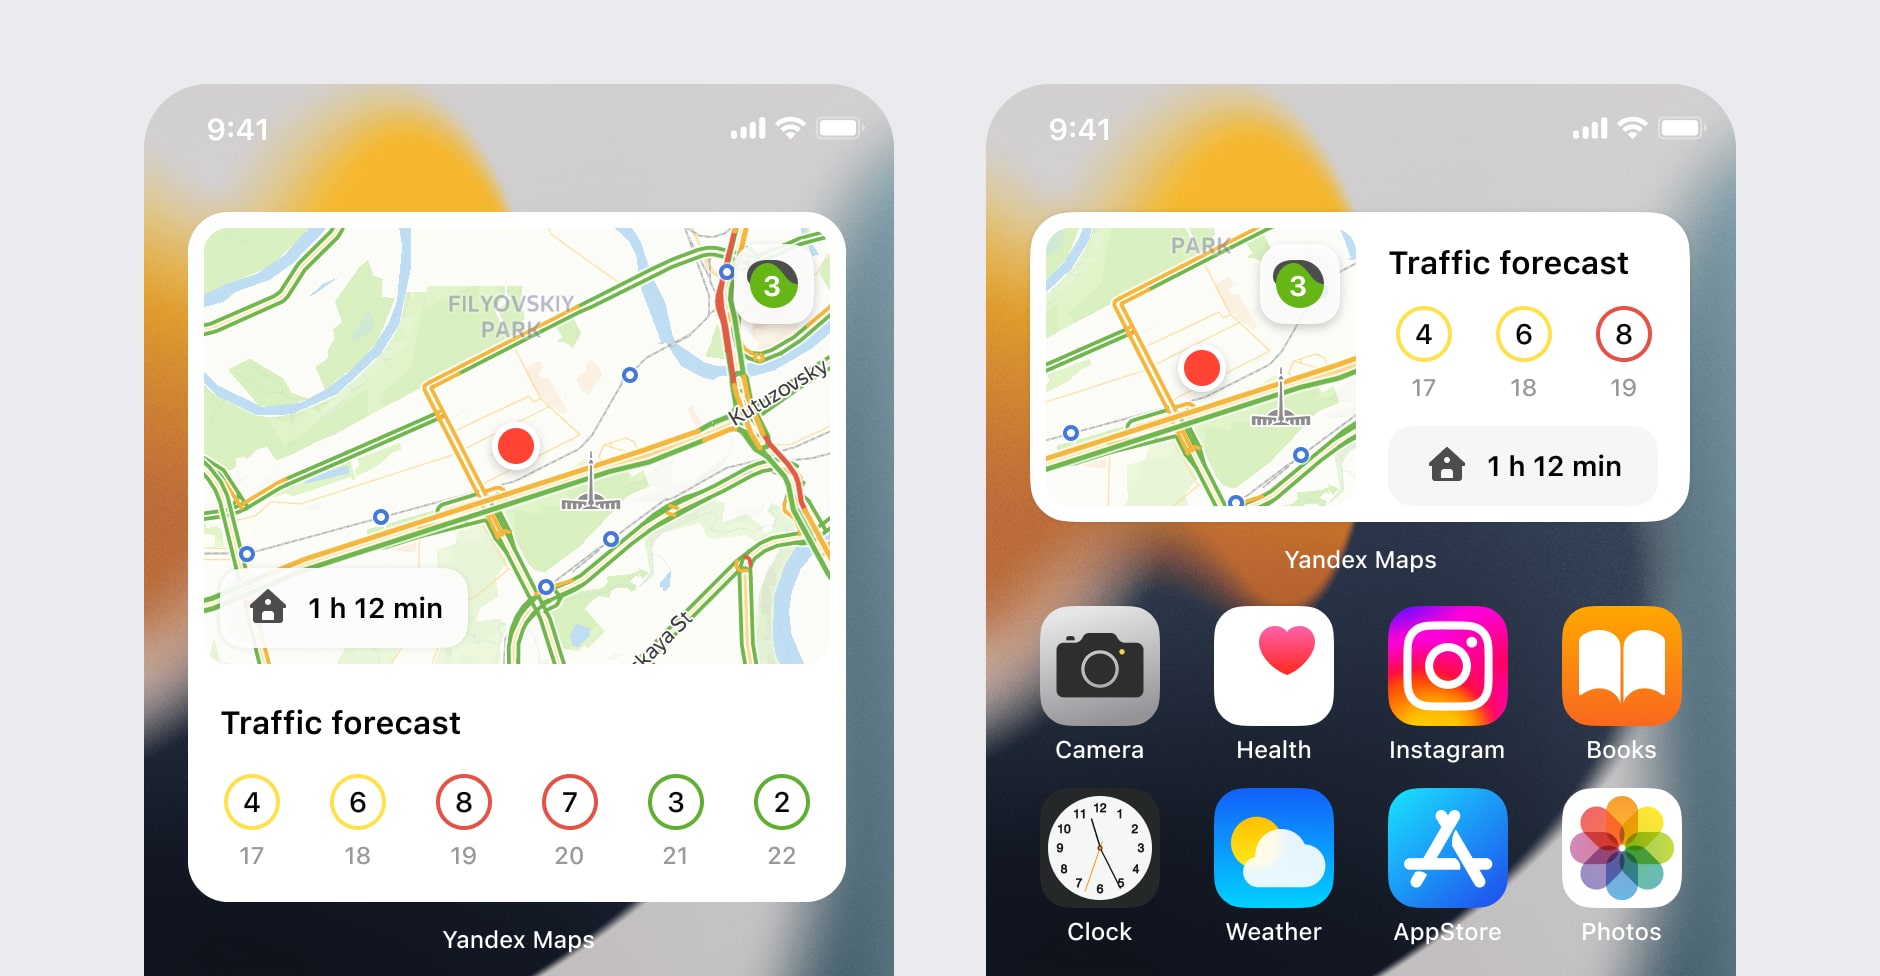
For small and medium widgets, the map covers roughly a 2 km radius. On larger devices, users see a wider area.
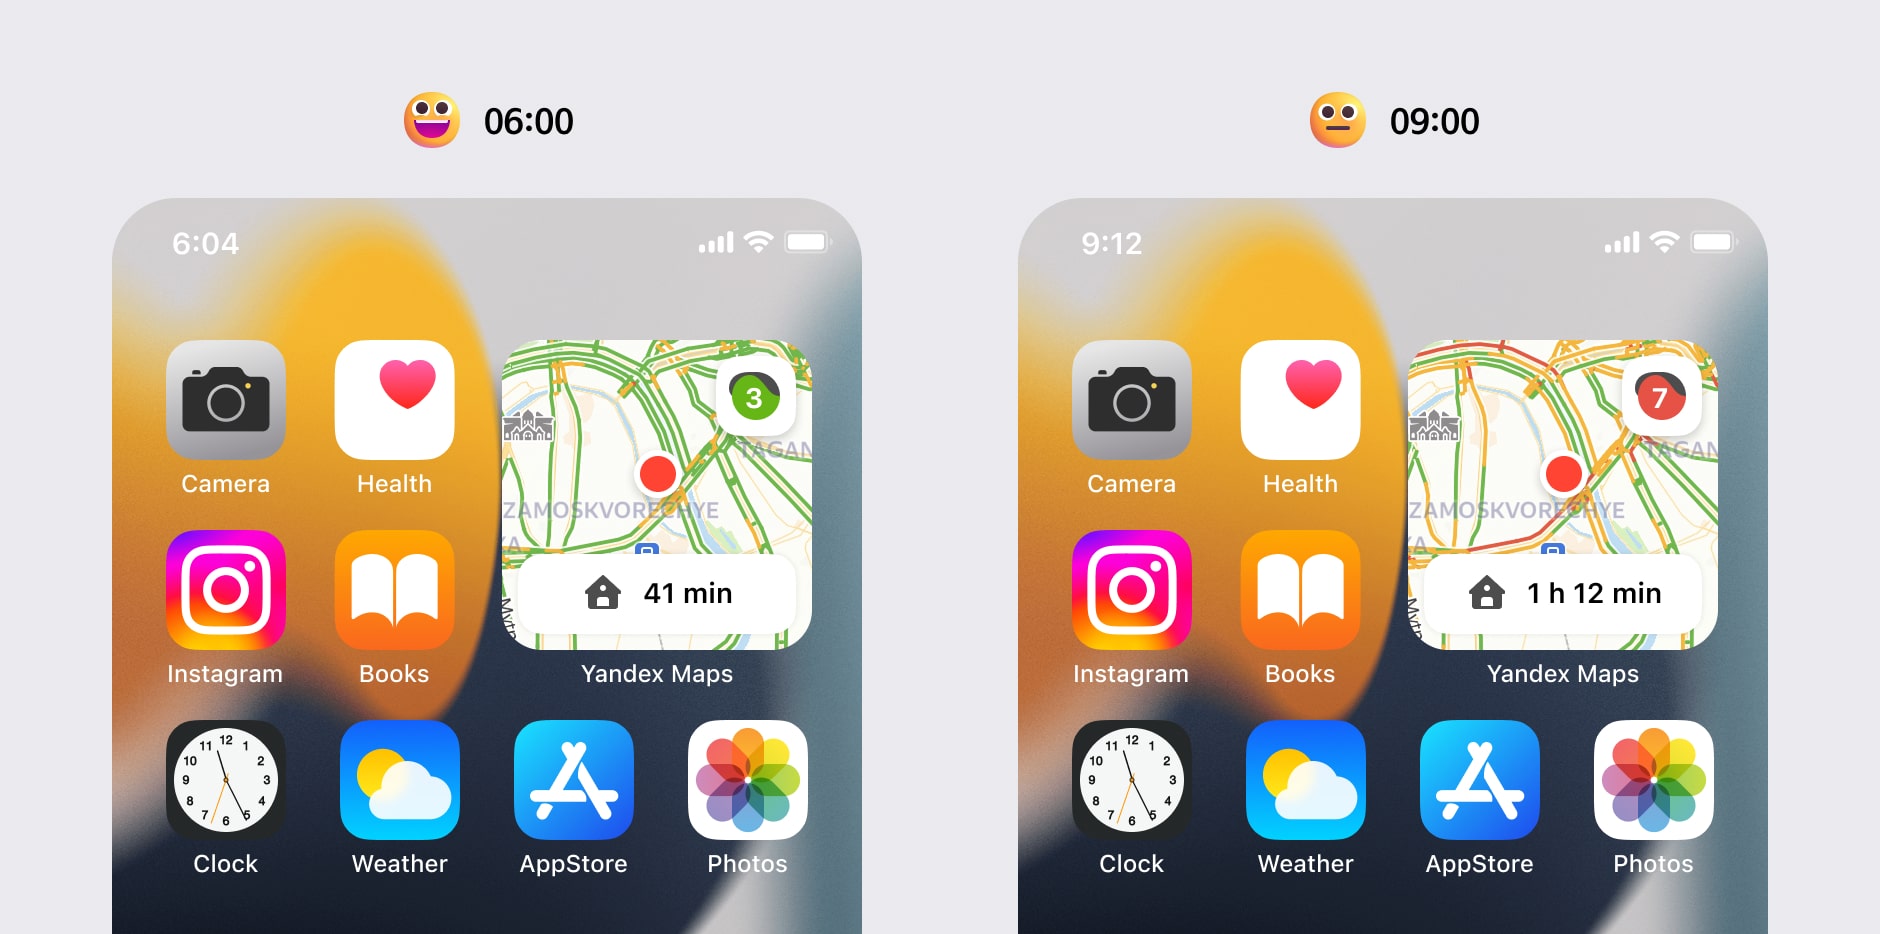
This approach helps users make quick decisions — whether to go home, go to work, or choose a different route — based on visible congestion nearby.
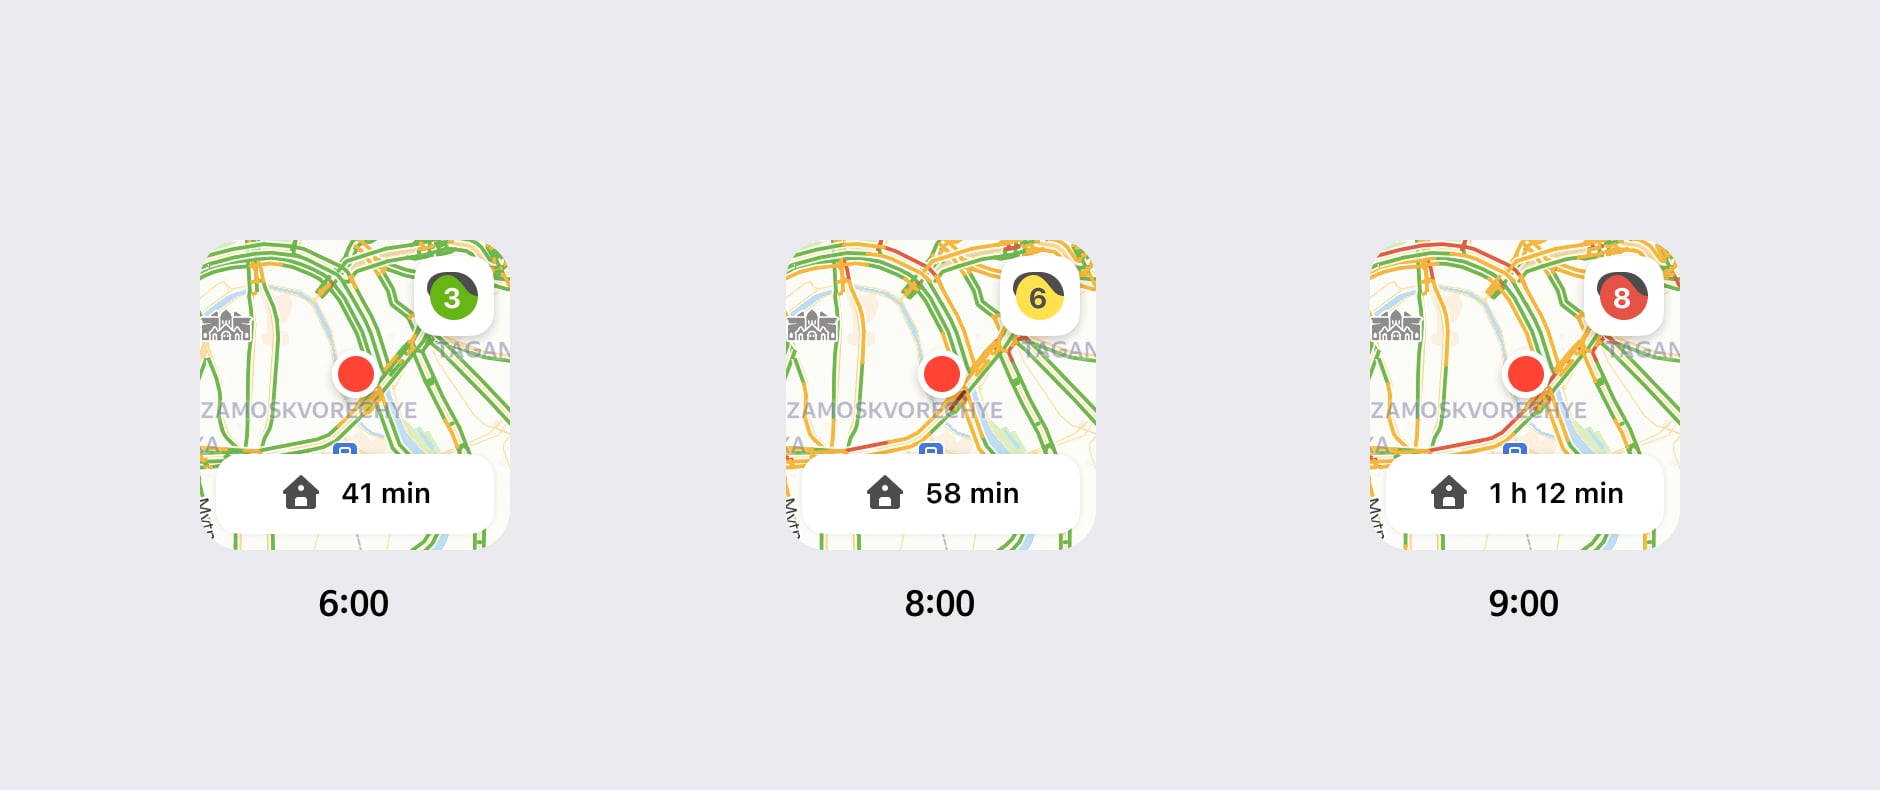
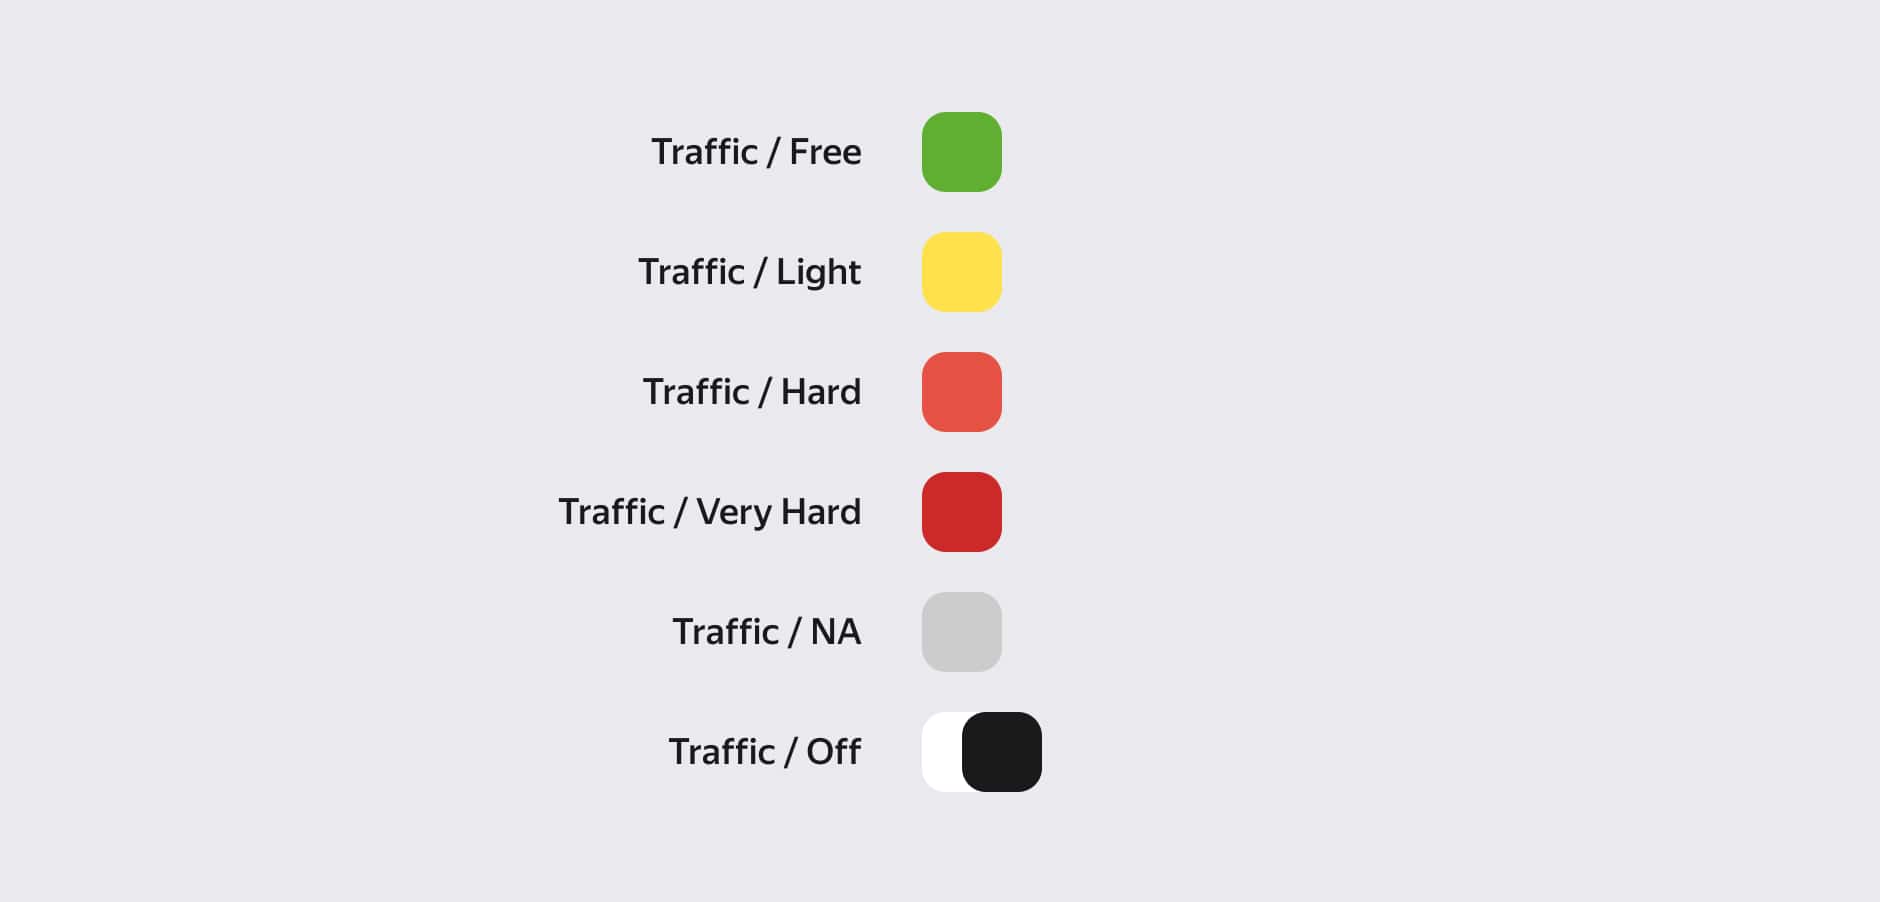
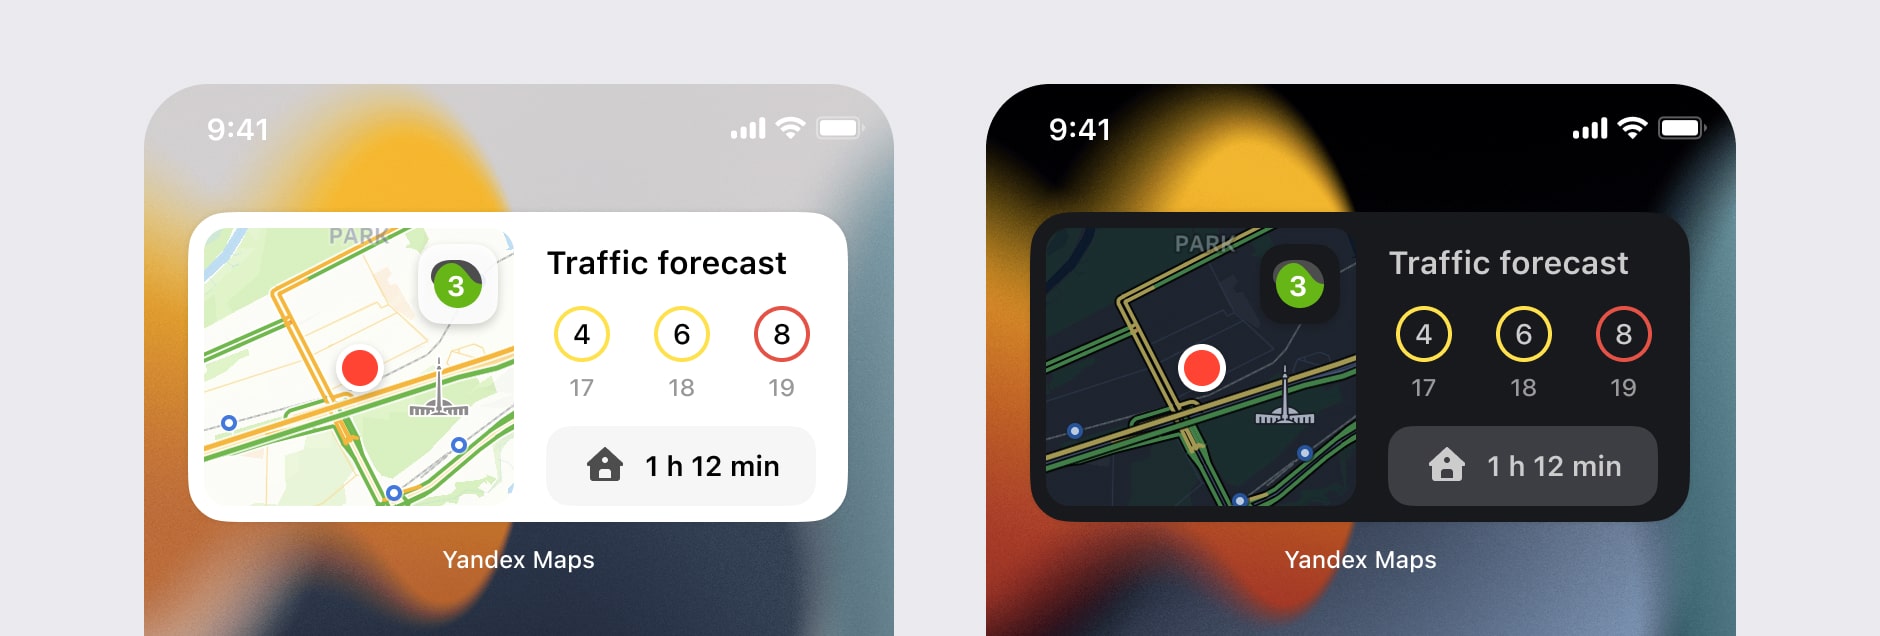
The widget uses the same color palette as the main application, with four traffic congestion levels.
The medium widget combines the map and forecast in one interface. Users can see citywide traffic, local congestion, and open routes or directions using the ETA button.
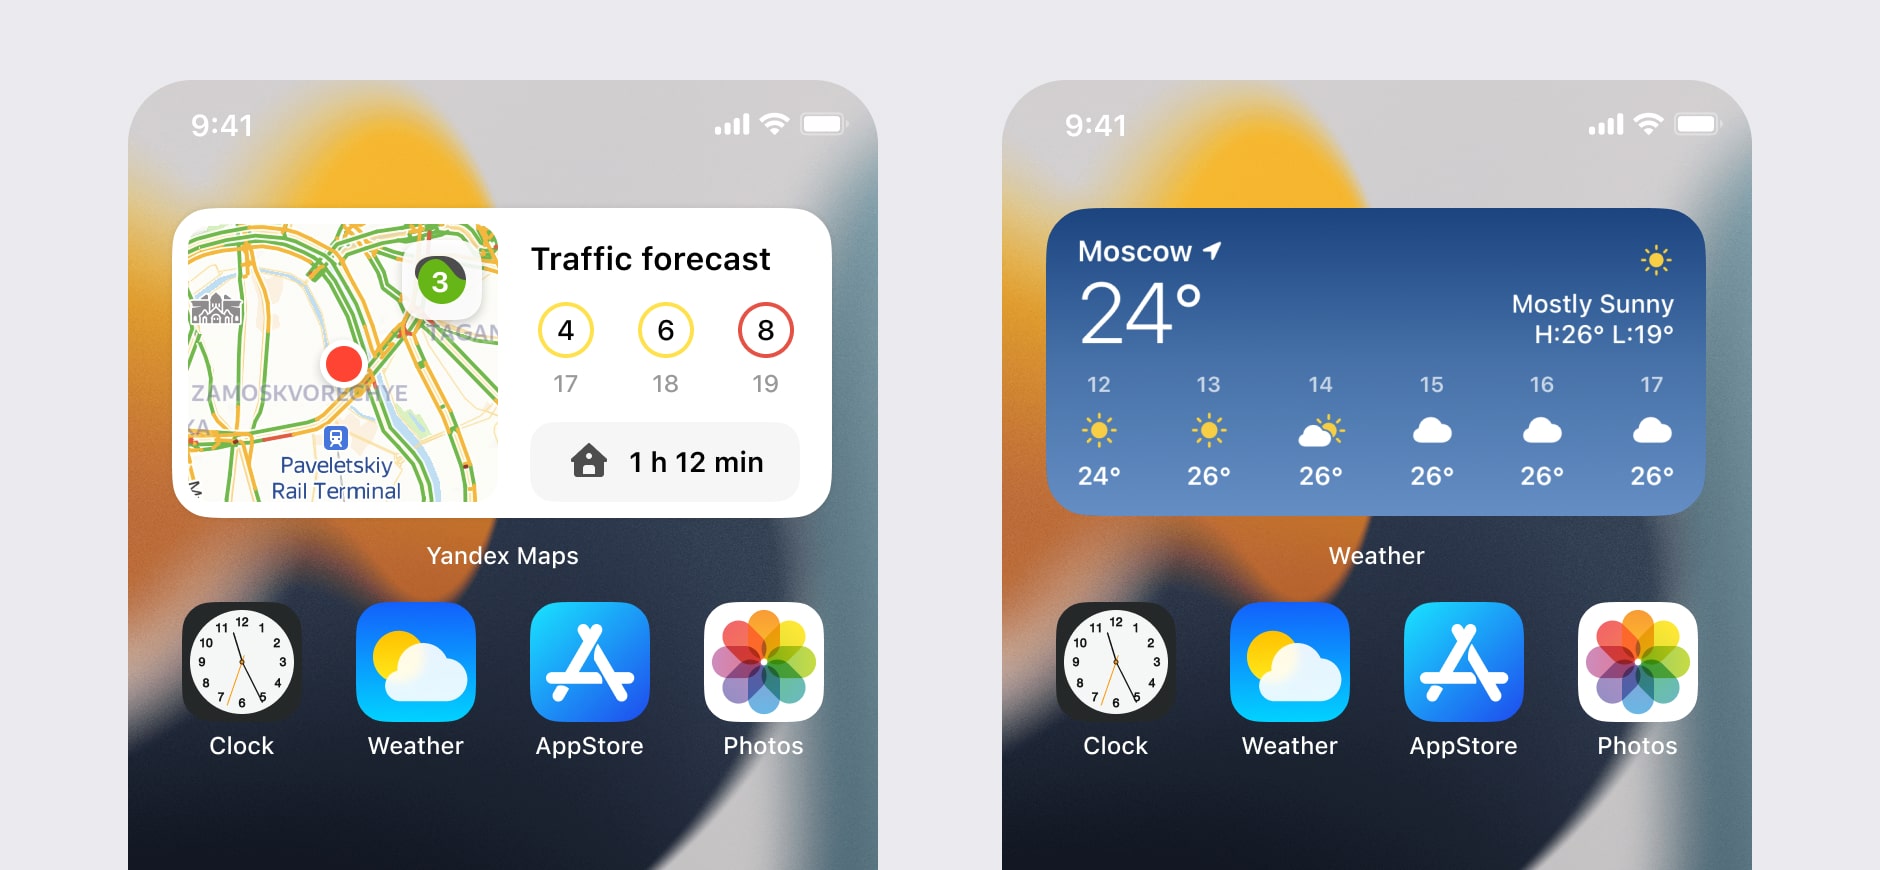
Weather conditions are also shown, as they can directly affect traffic and decision-making.
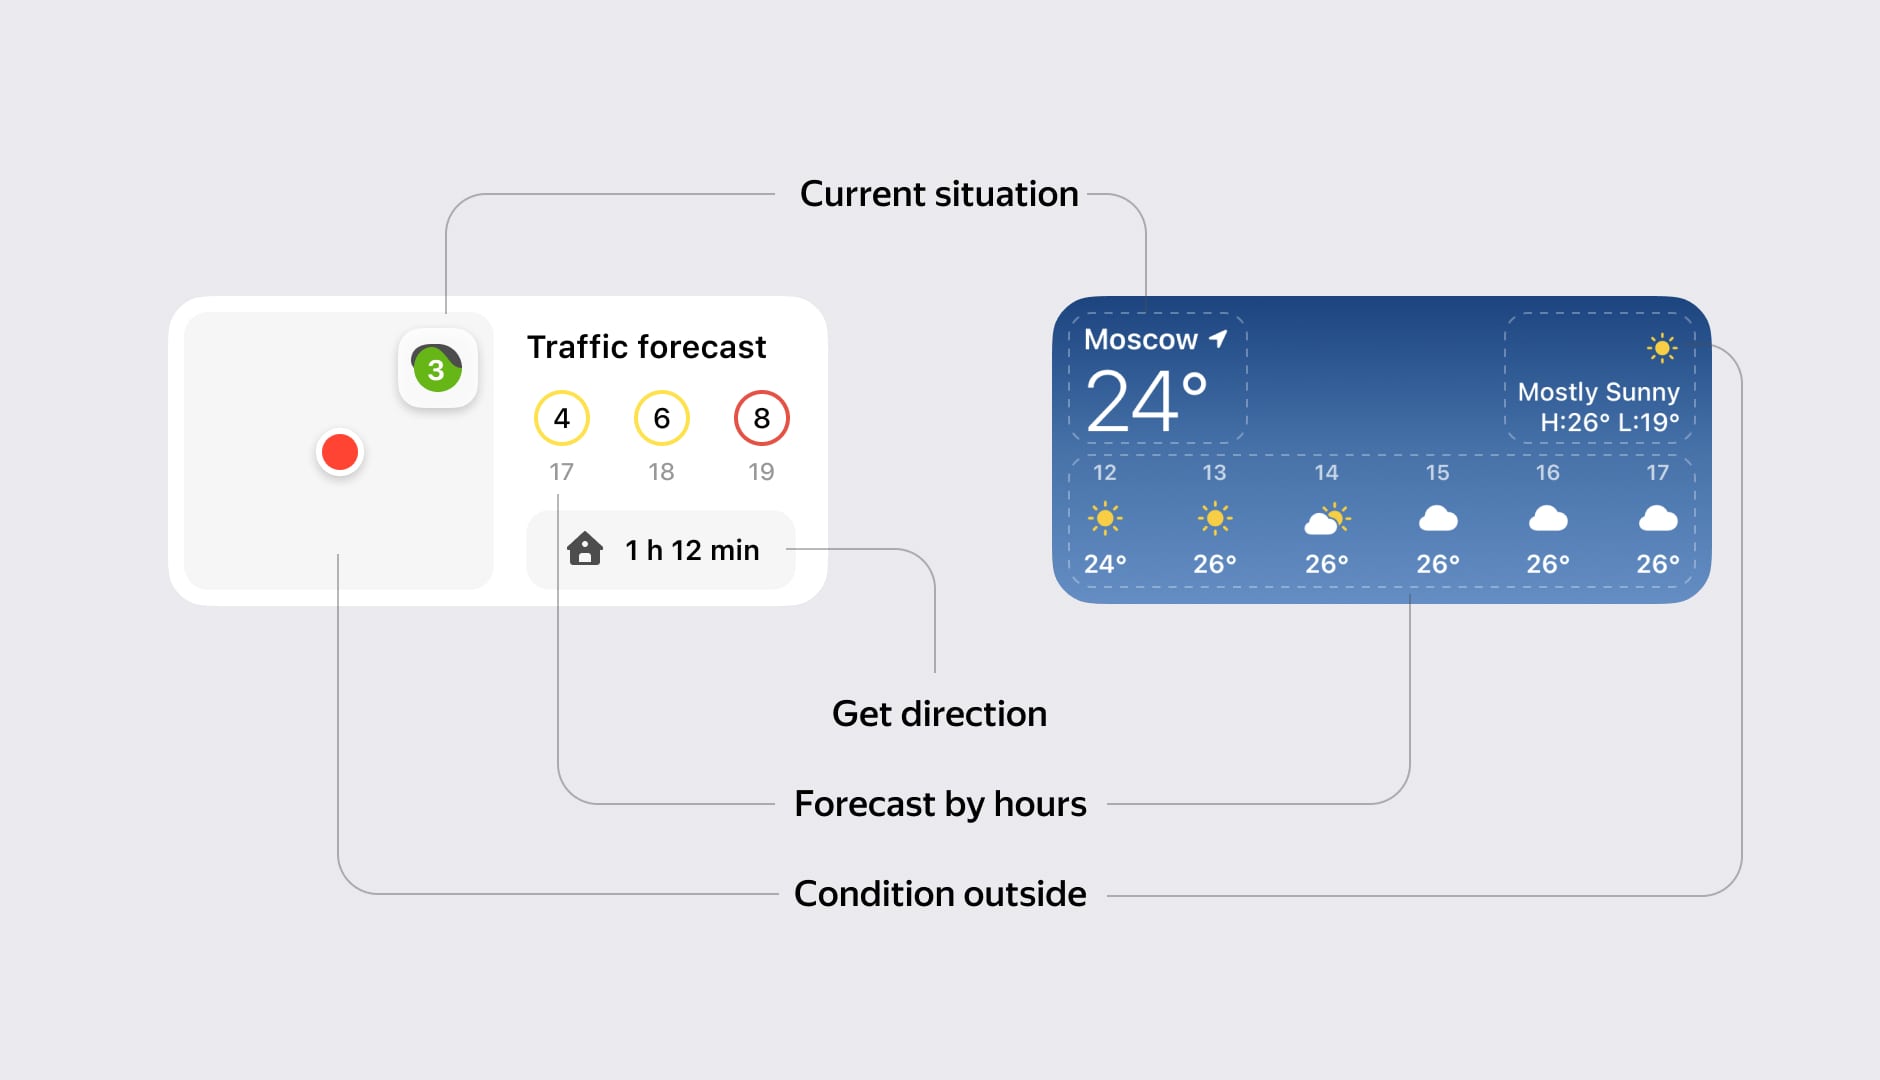
The large widget displays an extended map with a 6-hour traffic forecast.
Dark mode is supported and follows system settings.
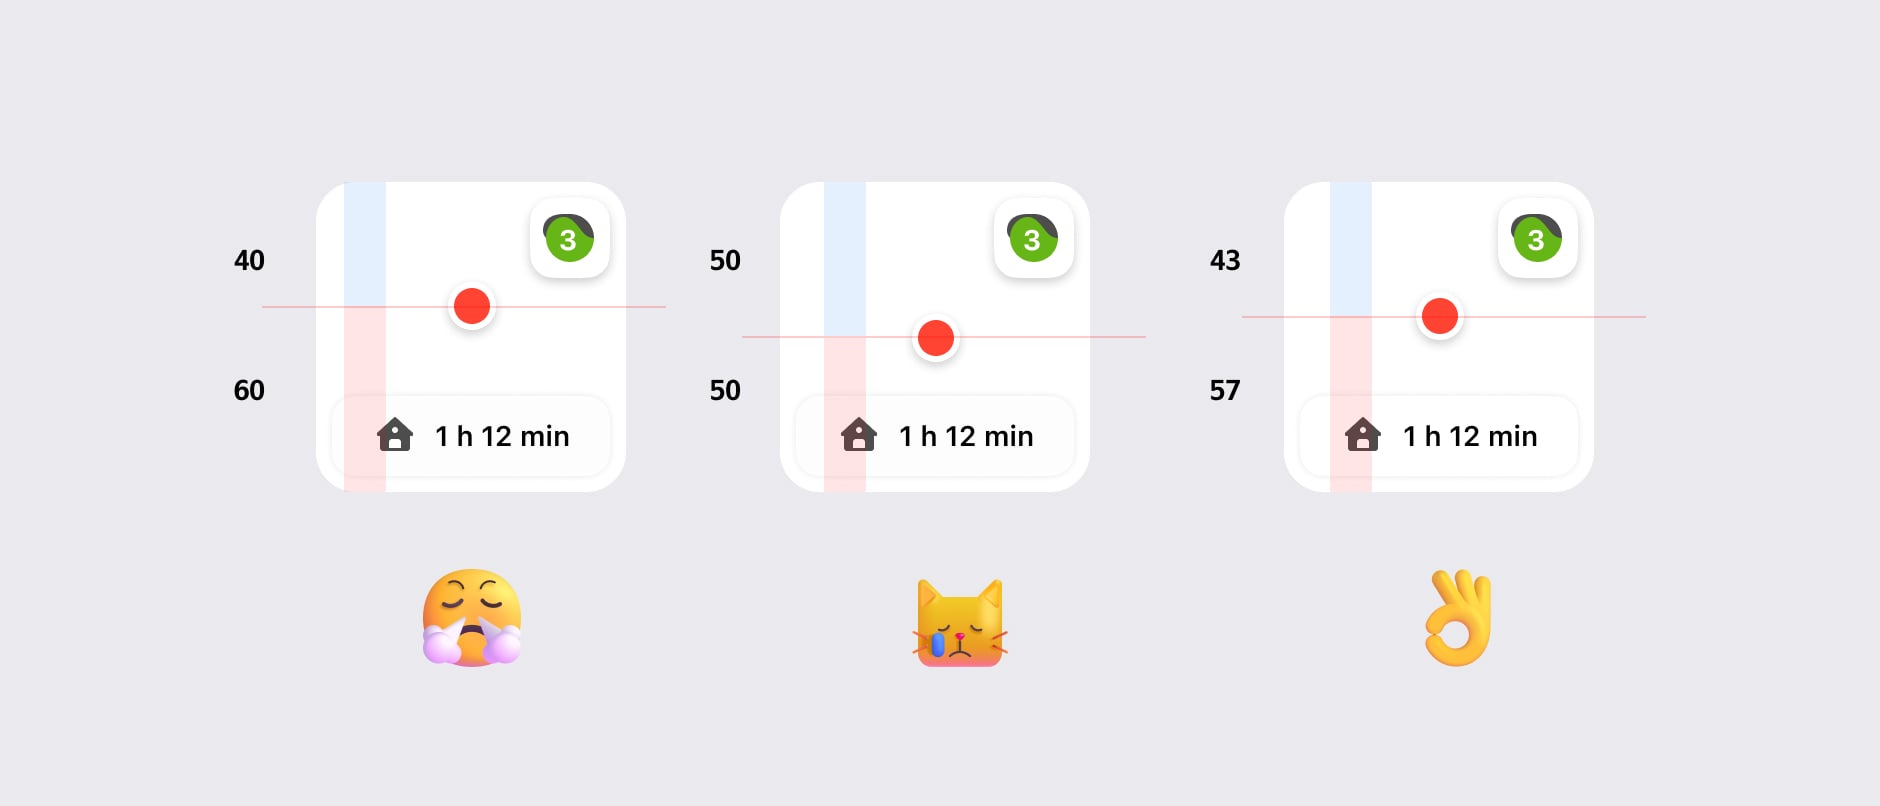
For small widgets, I used the optical center instead of the geometric center. Placing the location exactly in the center looked visually unbalanced.
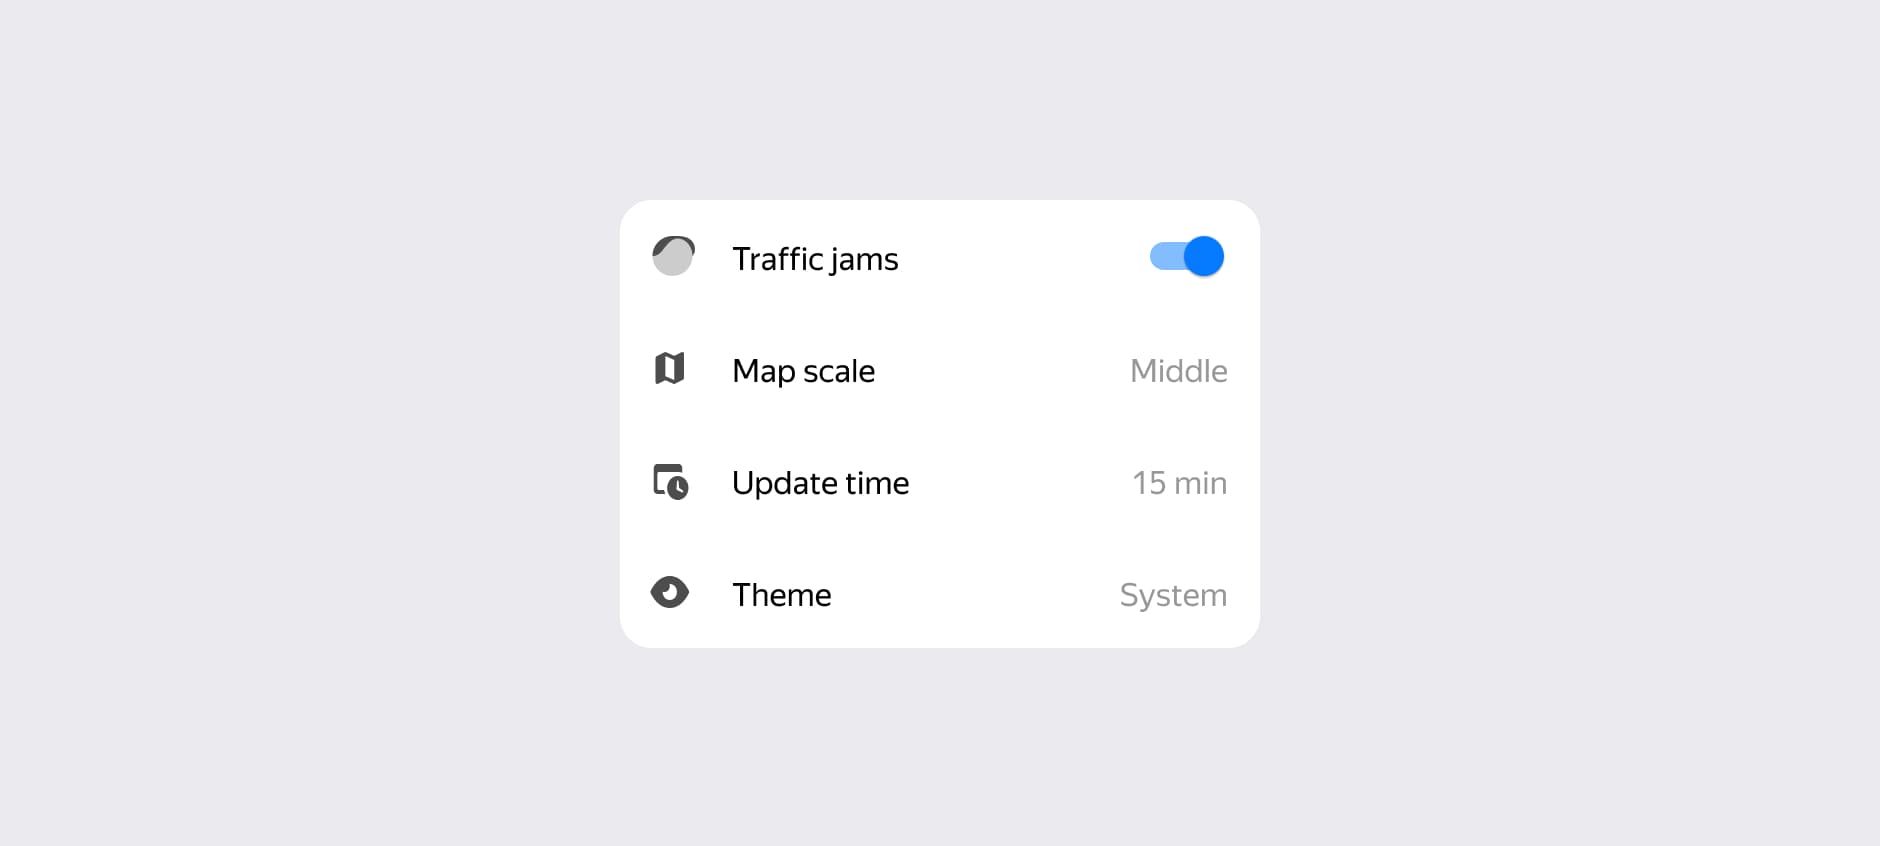
On Android, we support all widget grid sizes and provide settings during widget setup.
Android users can configure traffic layers, map scale, and update intervals, making the widget flexible for power users.
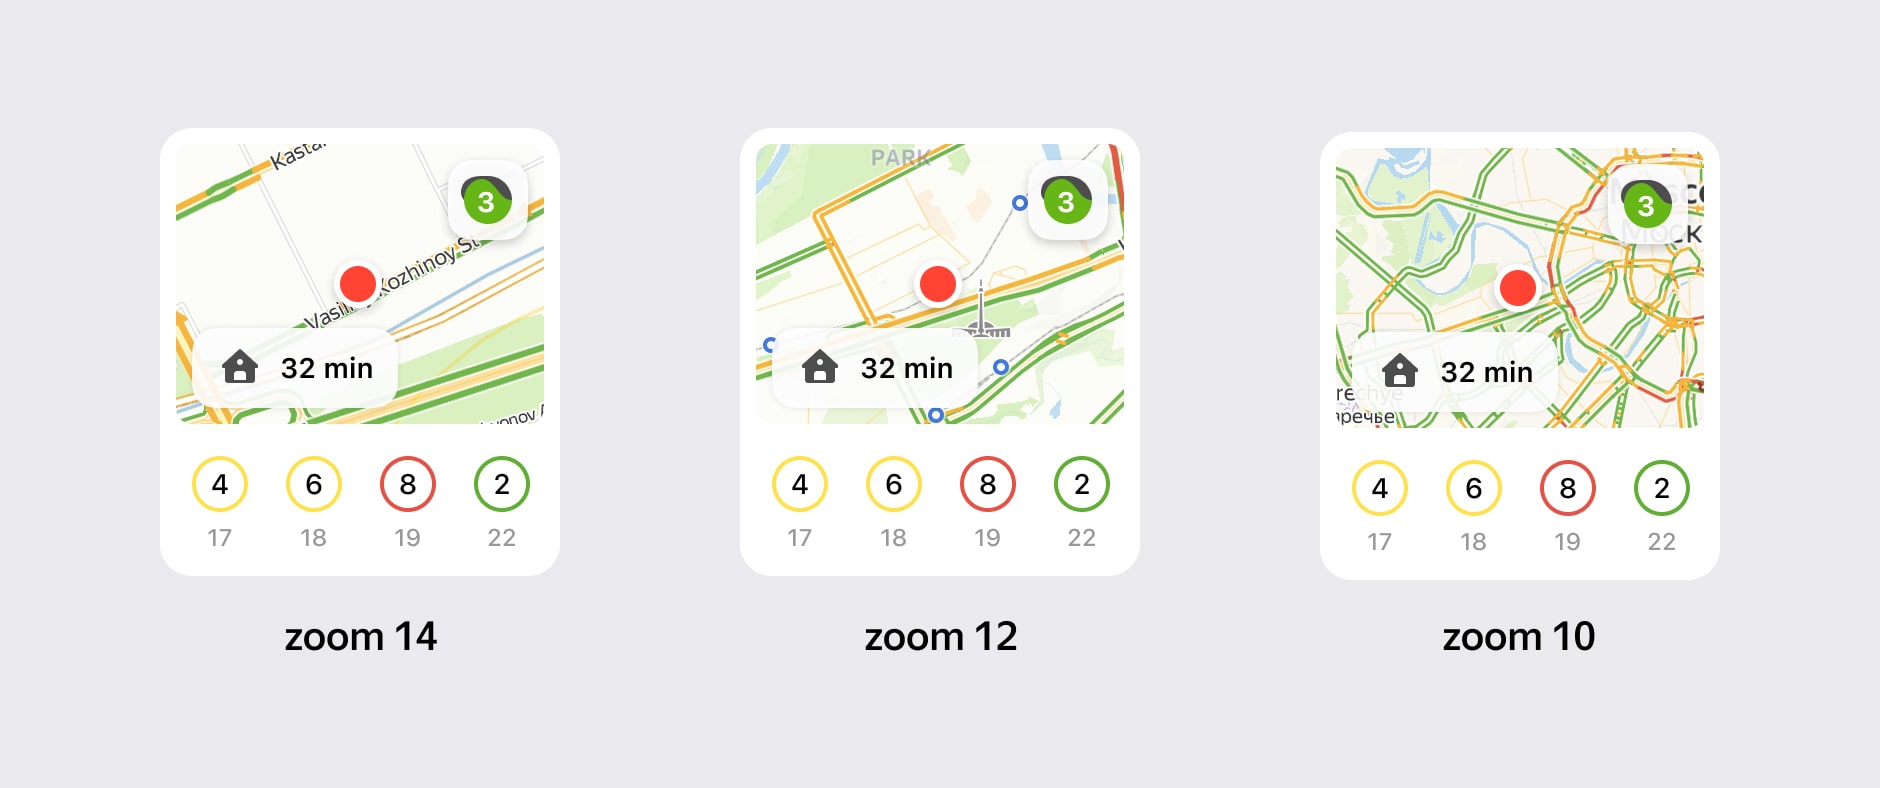
Different zoom levels (14, 12, 10) provide control over map scale.
Result
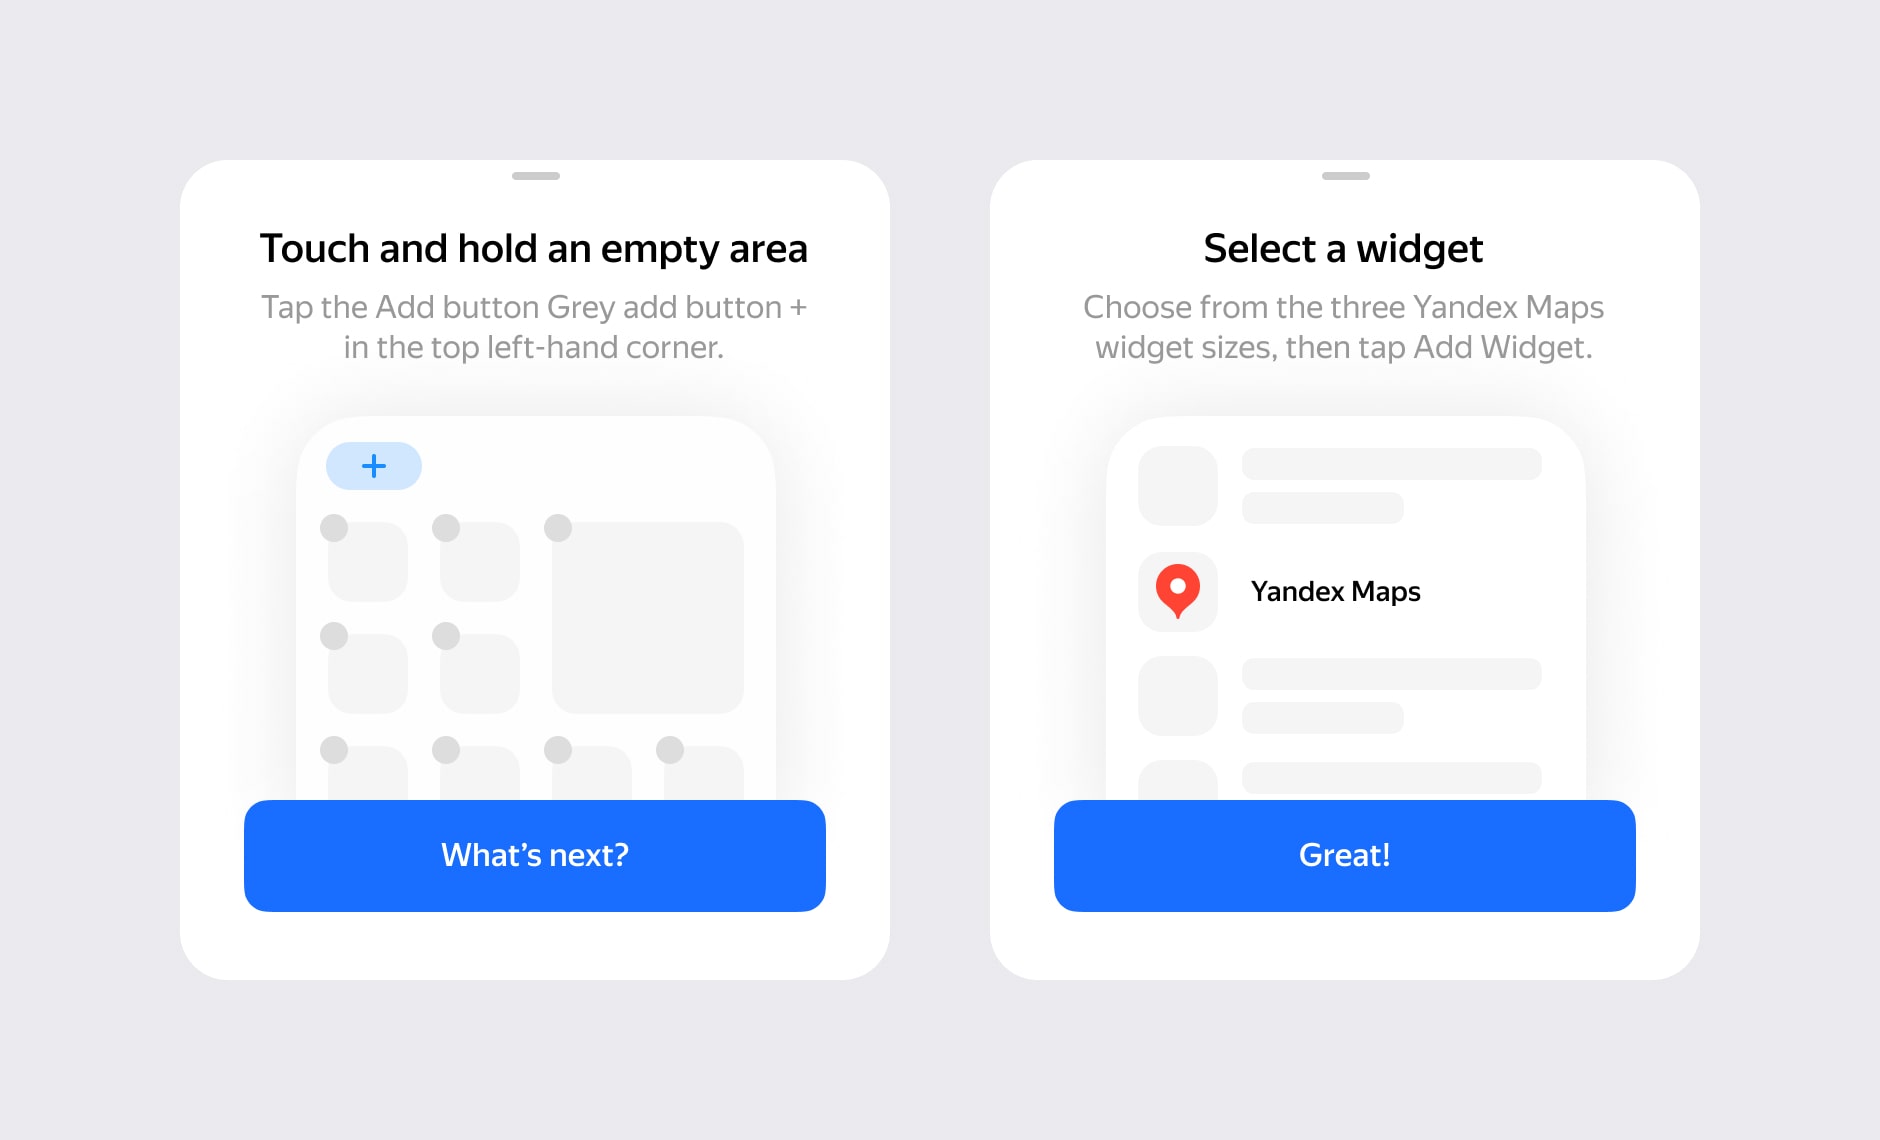
I designed onboarding screens explaining how to add widgets, especially important for iOS where widgets were a new feature.
Today, thousands of people use this widget daily on iOS and Android. Knowing that this work helps people make better everyday decisions is the most valuable outcome.